Cluster Dashboards
Each cluster has a dashboard accessible by clicking on it from the cluster list. This dashboard gives you a comprehensive overview of your infrastructure's state in real time.
Overview
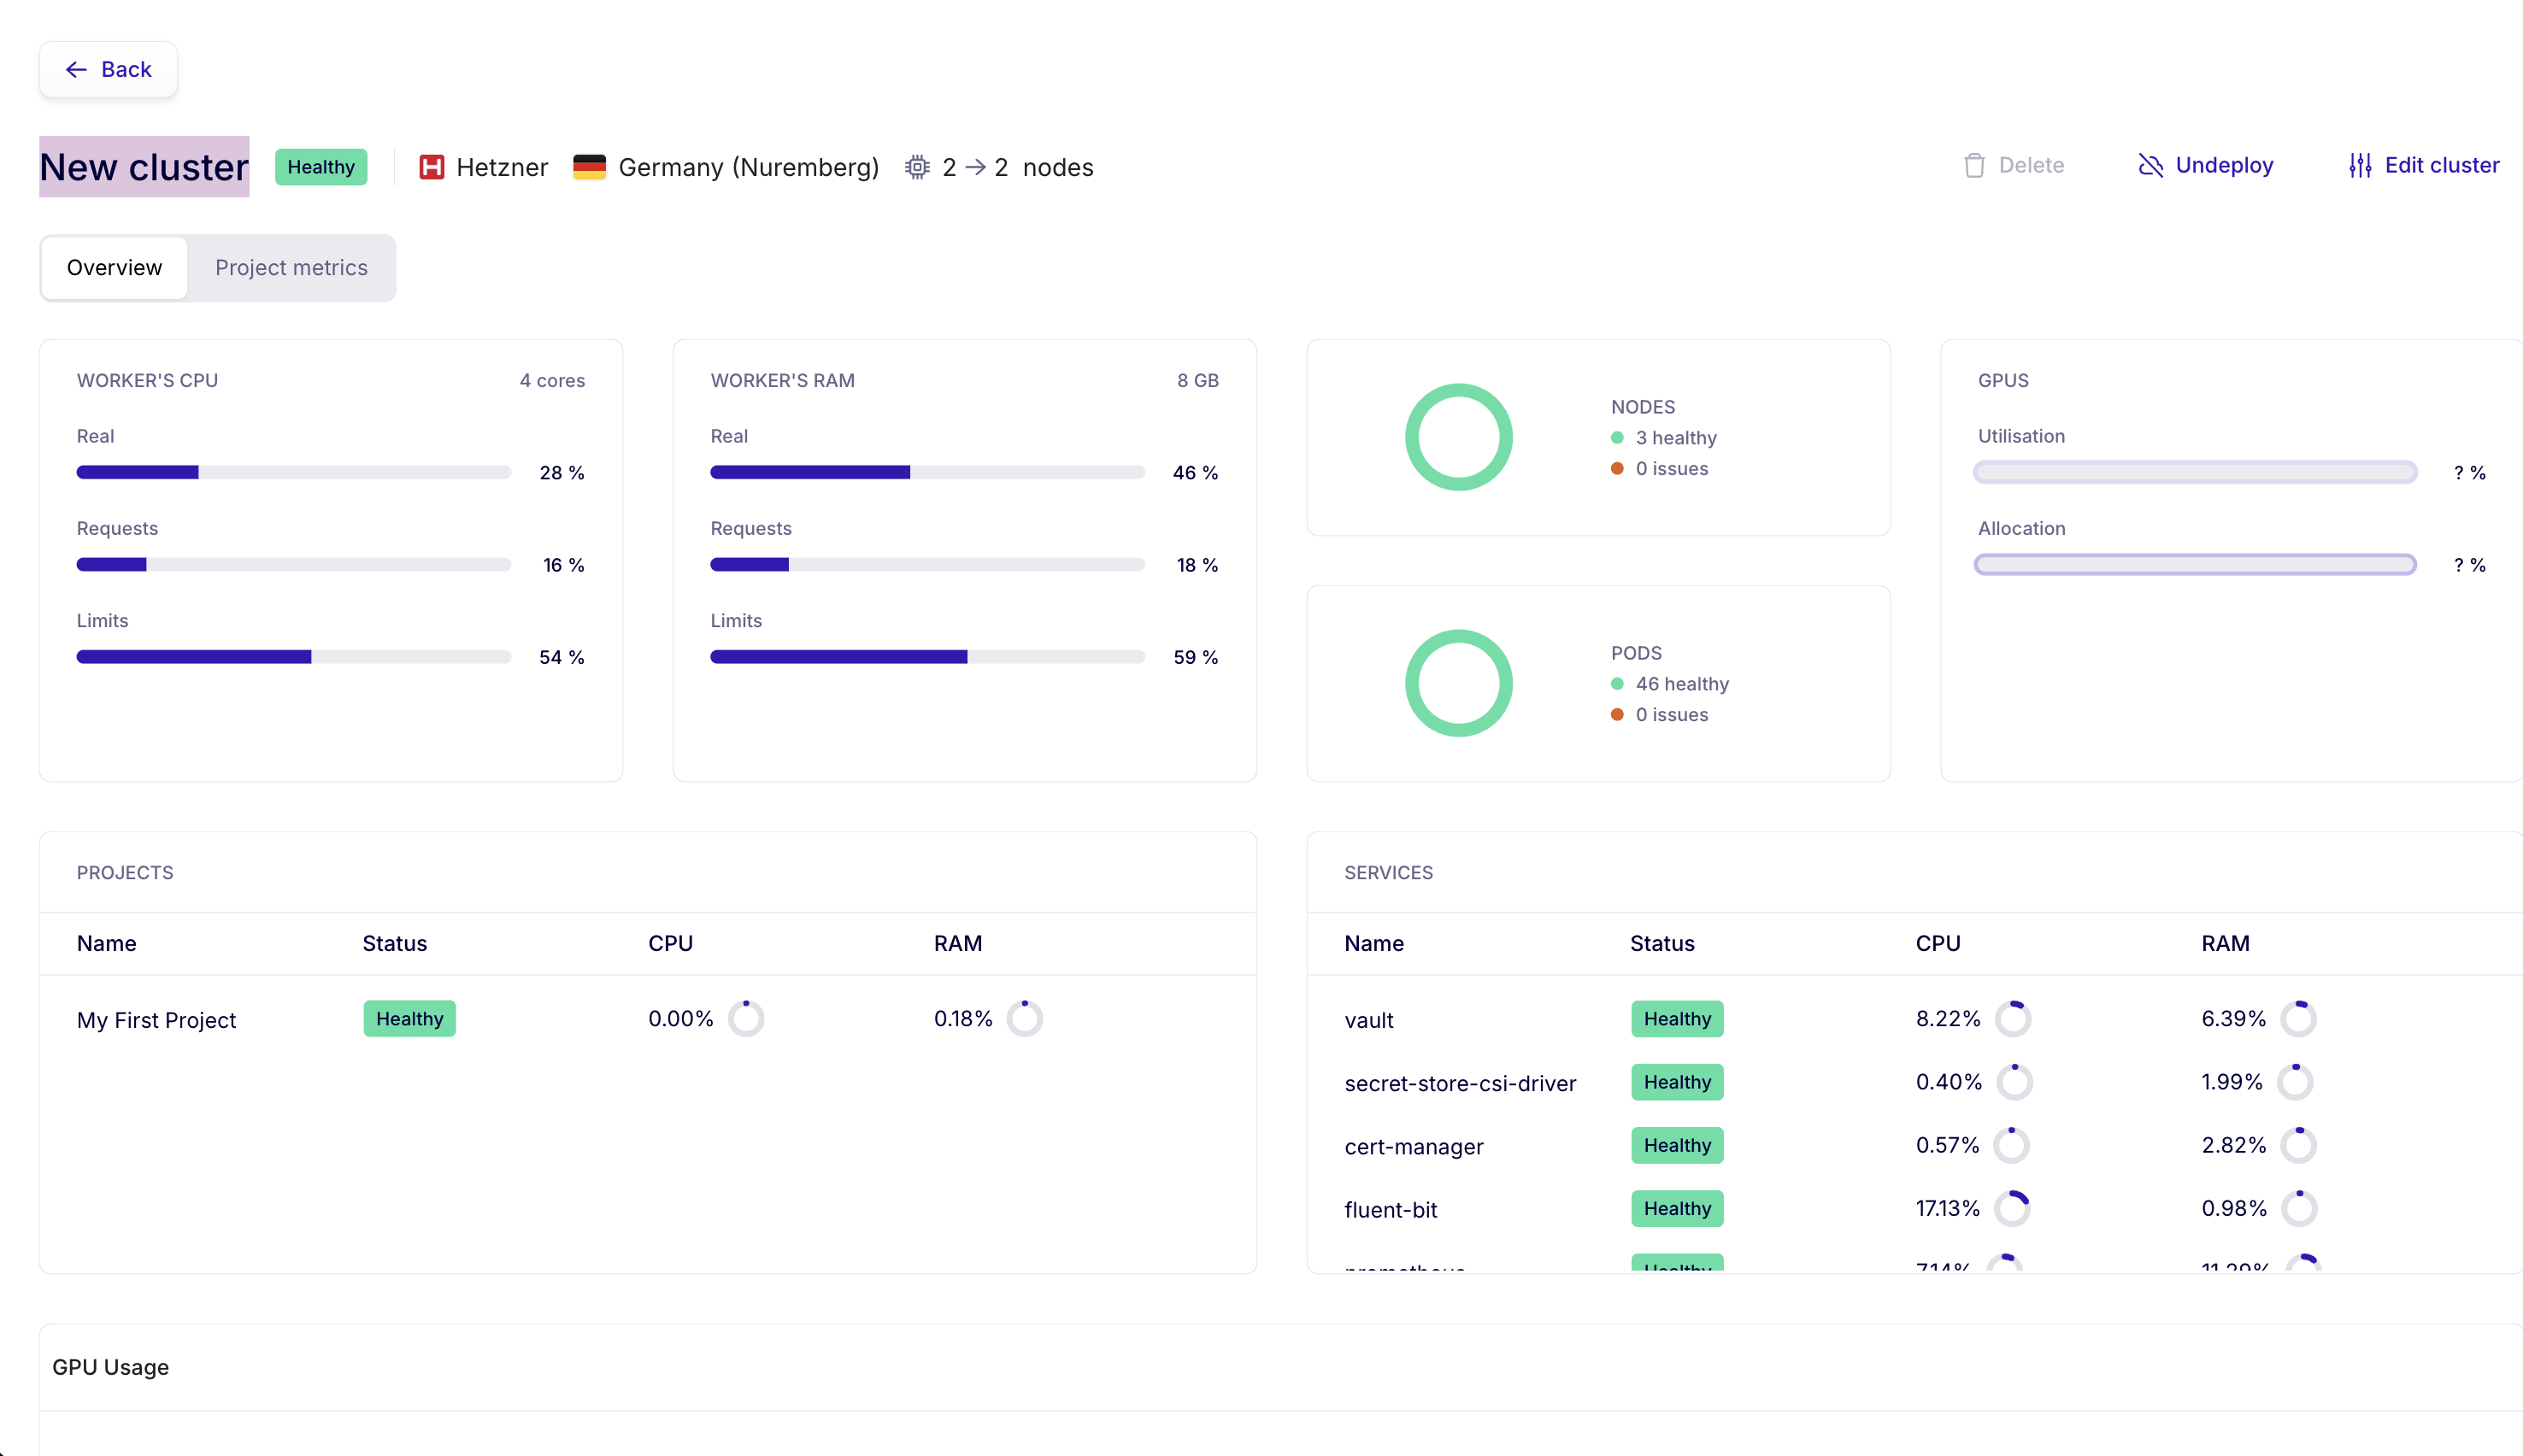
The Overview tab displays the cluster's global state at a glance.
Cluster resources
At the top of the dashboard, you'll find the global worker node metrics:
- Worker's CPU — Actual usage, requests, and limits as a percentage of total capacity (e.g., 4 cores)
- Worker's RAM — Same breakdown for memory (e.g., 8 GB)
- GPUs — GPU usage and allocation if your cluster has them
Node and pod status
Two visual indicators show your cluster's health:
- Nodes — Number of healthy nodes and number of issues
- Pods — Number of healthy pods and number of issues
Deployed projects
The Projects section lists all projects hosted on this cluster, showing for each:
- The project name
- The status (Healthy, Degraded, Critical)
- CPU and RAM consumption
System services
The Services section lists the internal services managed by Fransys (vault, cert-manager, fluent-bit, etc.) with their status and resource consumption. These services run automatically — you don't need to manage them.
Project metrics view
The Project metrics tab displays detailed metrics per project with time-series charts.
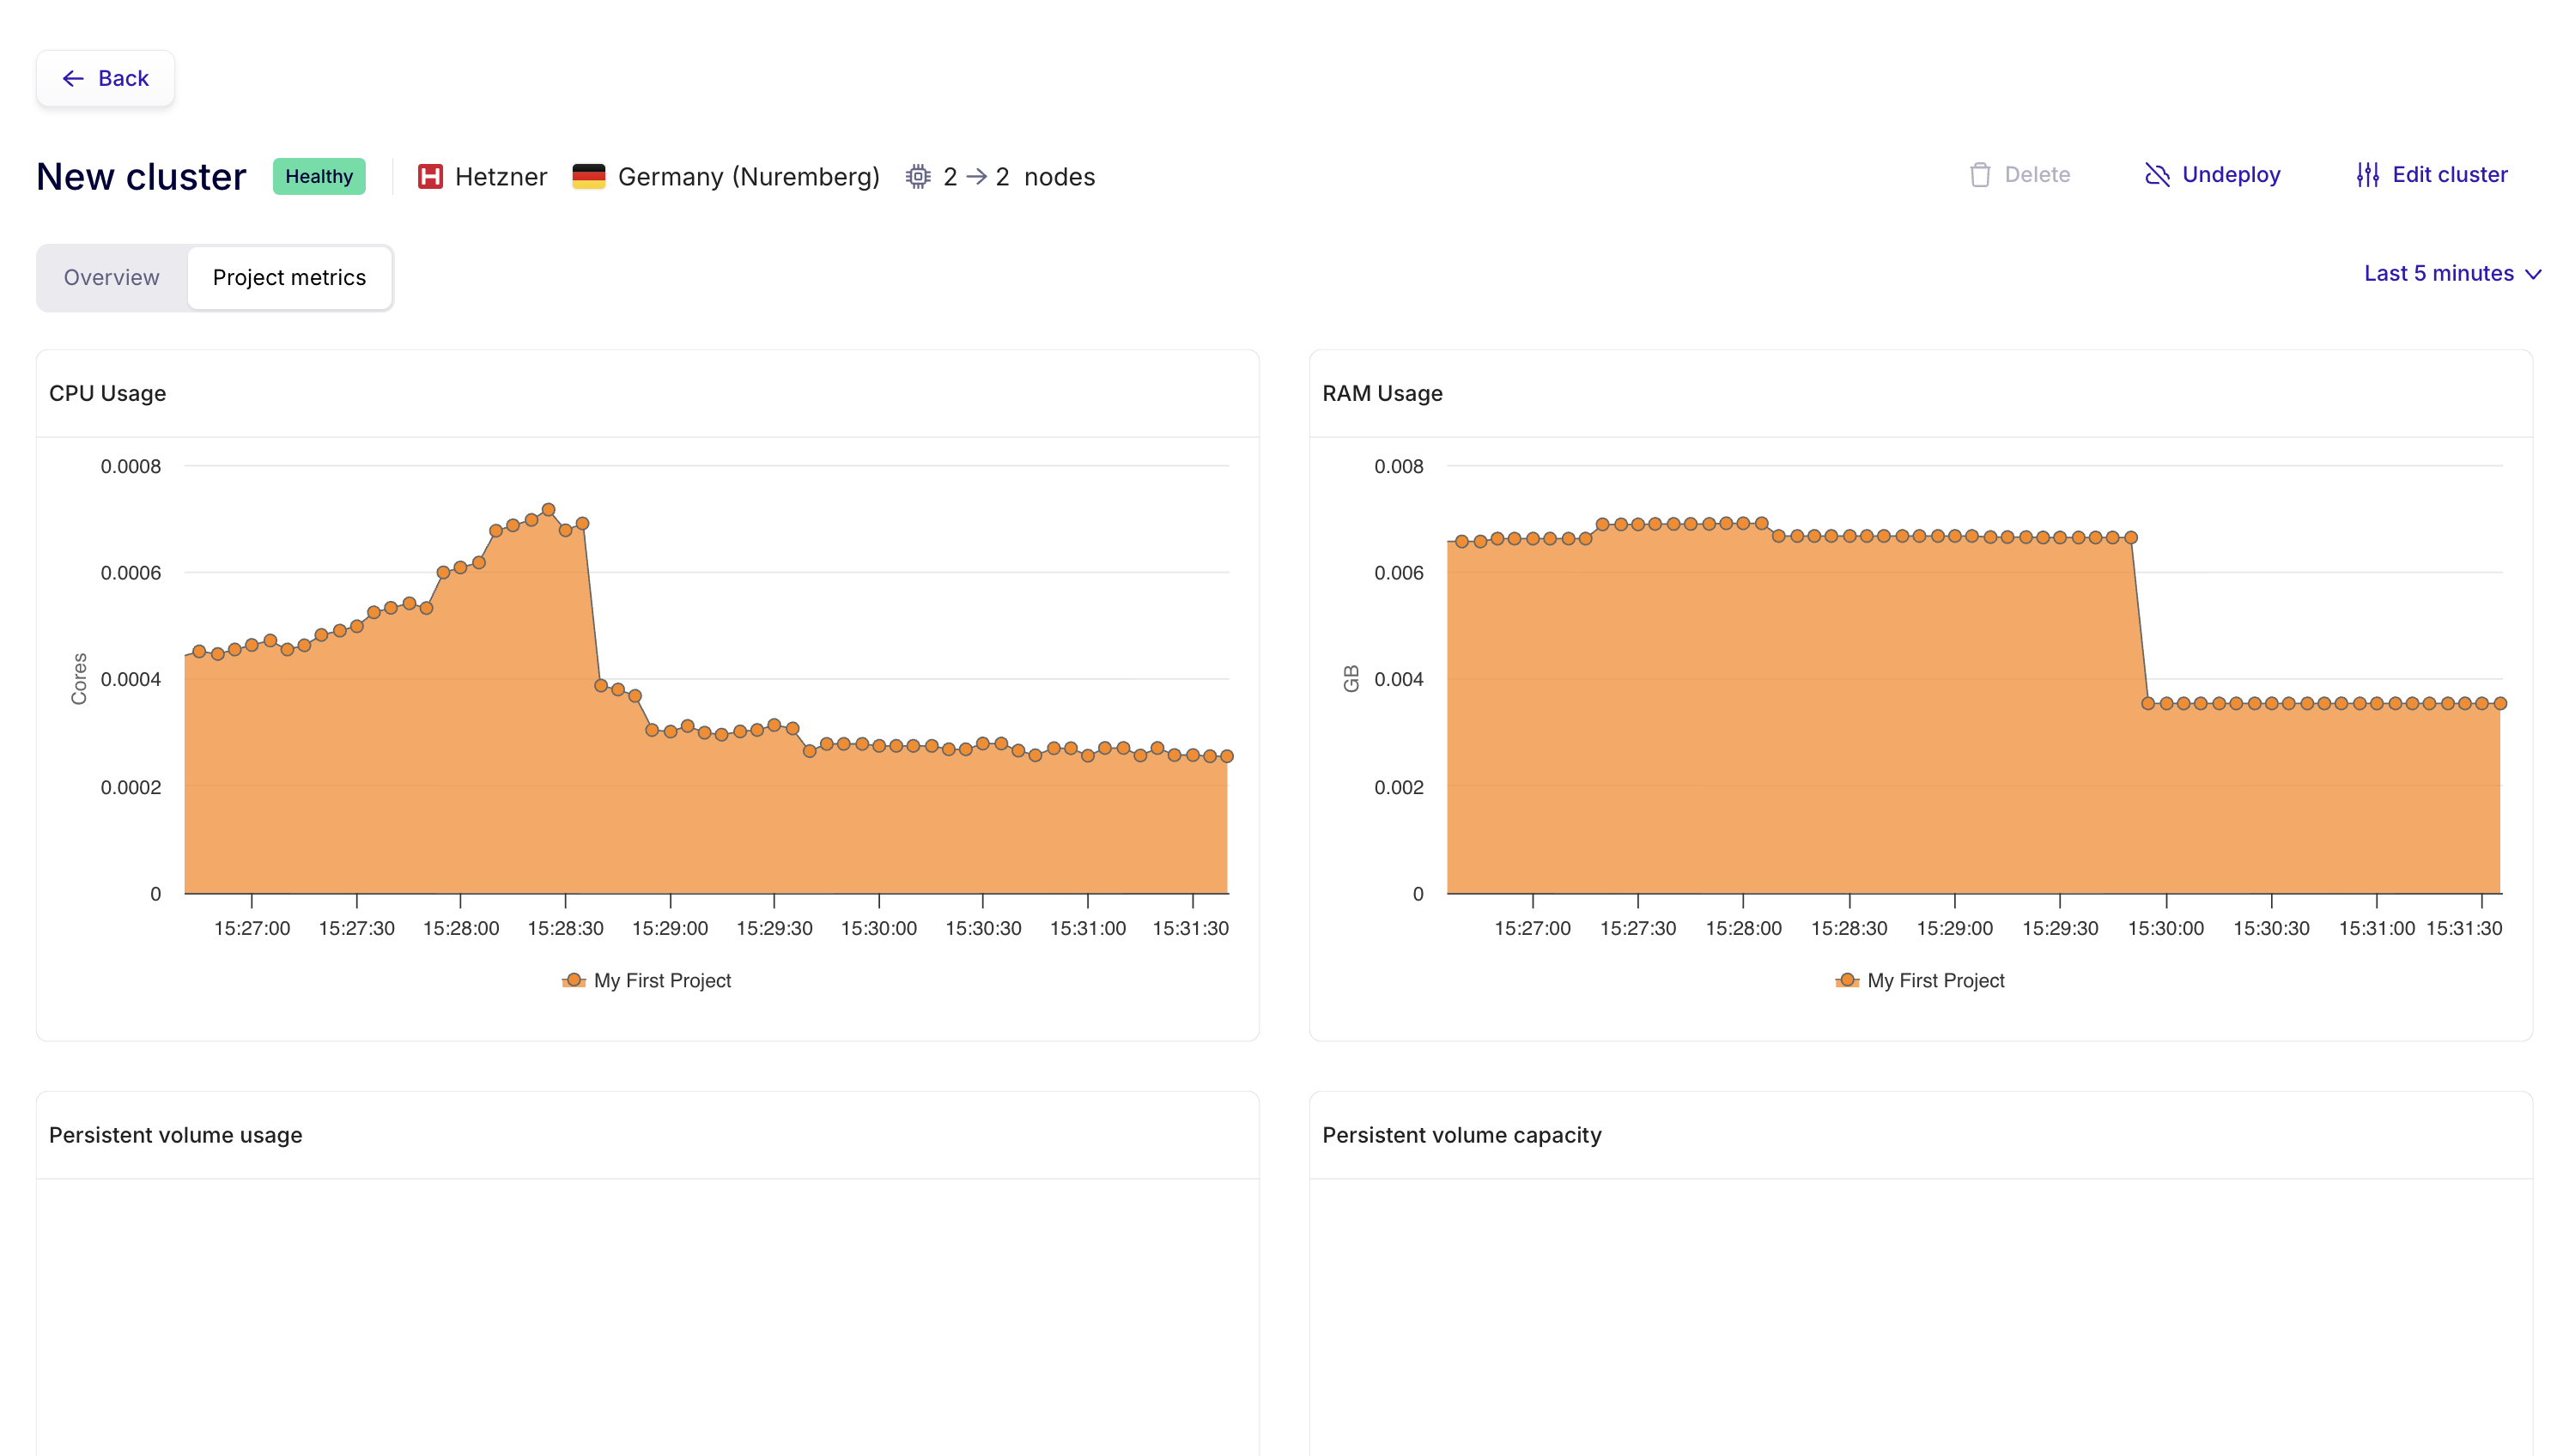
You'll find:
- CPU Usage — CPU usage chart over time, per project
- RAM Usage — Memory usage chart over time, per project
- Persistent volume usage — Disk space used by persistent volumes
- Persistent volume capacity — Total capacity allocated to volumes
The time period selector in the top right (e.g., Last 5 minutes) lets you adjust the displayed time window.